System Overview
Runtime loop, evidence path, worker isolation, and report aggregation.
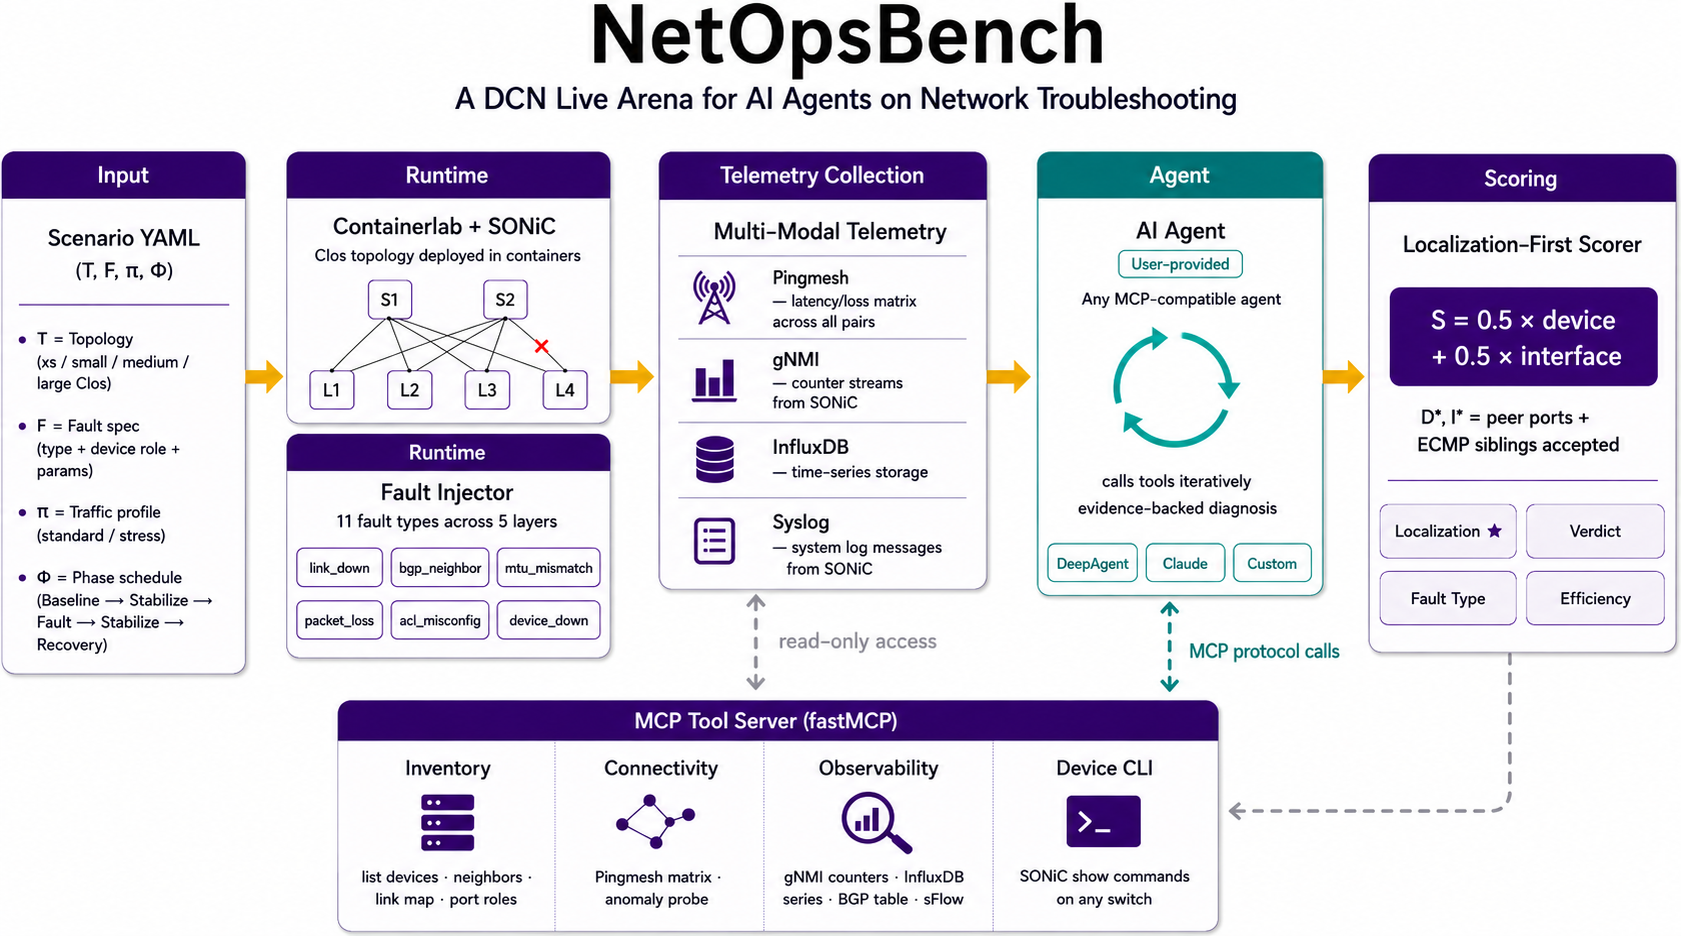
A benchmark run is a closed loop: resolve a scenario, provision a topology, inject a fault or healthy episode, collect evidence, call the agent, and score the returned DiagnosisResult.
Runtime loop
| Stage | What happens |
|---|---|
| Scenario and topology | A generated scenario selects topology scale, fault type, target device, and target interface. All scenarios use the canonical standard background traffic model. |
| Runtime provisioning | The SDK provisions a Linux / Containerlab runtime and starts observability services. |
| Fault episode | The scenario executor applies traffic generation, injects the selected fault, waits through the observation window, and records symptoms. |
| Diagnosis context | The platform assembles topology, symptoms, Pingmesh summaries, runtime metadata, and optional tools into DiagnosticContext. |
| Agent call | The agent investigates evidence and returns DiagnosisResult. |
| Scoring and report | The evaluator compares verdict, fault type, device, and interface against ground truth and writes reports plus artifacts. |
Pingmesh is the first symptom source for many cases. It exposes path-level loss, latency, and reachability changes before deeper tool use. Agents can correlate that signal with topology, BGP state, routes, interface counters, syslog, and connectivity checks.
Evidence available to agents
| Evidence source | Typical use |
|---|---|
| Topology metadata | Identify spines, leaves, clients, links, racks, and candidate paths. |
| Pingmesh summaries | Detect unhealthy source-destination pairs and affected path domains. |
| BGP state and routes | Separate control-plane failures from data-plane impairments. |
| Interface state and counters | Localize down links, drops, errors, congestion, or MTU symptoms. |
| Syslog and telemetry | Correlate operational events with the scenario window. |
| Connectivity checks | Validate current reachability and path selection. |
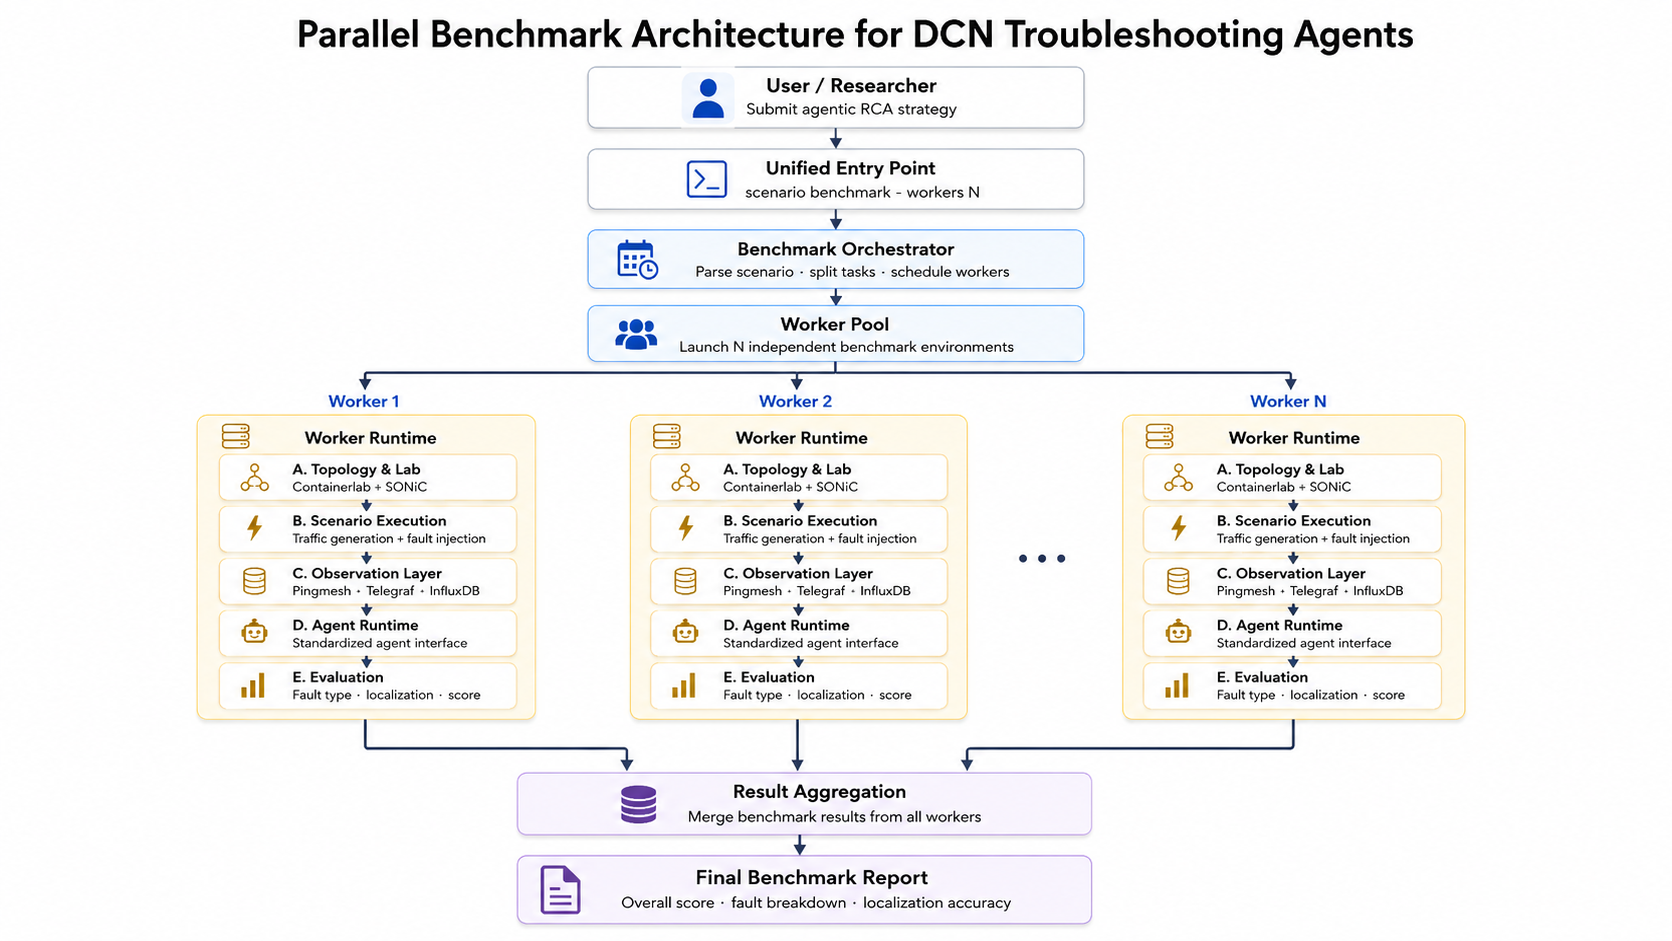
Worker-pool execution
Suite runs use a worker pool when workers=N. Each worker owns a separate lab and telemetry namespace so concurrent scenarios do not mix symptoms.
| Step | What happens |
|---|---|
| Submit run | The user passes an agent plus one scenario or a suite into NetOpsBench(...).sessions. |
| Start session | The session manager resolves scenarios, infers scale, creates a run id, and prepares artifact paths. |
| Build runtime pool | The runtime manager creates workers with separate lab names, topology directories, management subnets, buckets, logs, and raw result paths. |
| Deploy workers | Each worker provisions an independent Containerlab / SONiC topology and starts worker-local telemetry against shared core observability services. |
| Schedule scenarios | The dispatcher assigns scenarios across workers and runs them in parallel when more than one worker is available. |
| Execute and score | Each worker runs the episode, builds context, calls the agent, records raw output, and scores the case. |
| Aggregate report | The dispatcher merges worker summaries, scenario summaries, raw artifact paths, and aggregate metrics into one BenchmarkReport. |
Shared and worker-local state
| Layer | Components |
|---|---|
| Shared | SDK entrypoint, session orchestration, scenario assignment, final report aggregation, shared observability services. |
| Worker-local | Containerlab topology, SONiC nodes, management subnet, fault episode, Pingmesh / Telegraf data, InfluxDB bucket, raw outputs, worker logs. |
Evaluators are worker-local during concurrent execution. Final report generation uses a separate aggregation evaluator after worker results are merged in deterministic worker-index order.
SDK mapping
| SDK call | Architecture path |
|---|---|
run_scenario(...) | One worker, one scenario, one report. |
run_suite(..., workers=N) | Scenarios distributed across isolated workers and merged into one report. |
run_on_runtime_suite(...) | Same execution path, but the caller owns the already-provisioned runtime pool. |
Use the single-scenario path for agent contract validation. Use suite or scale runs when collecting benchmark-level evidence.