Benchmark Runs
Benchmark Results
Reference cross-model NetOpsBench results.
This page records the public trace dataset snapshot. Treat it as a reference snapshot under the documented methodology, not as a stable model ranking. Provider defaults, model versions, prompts, and tool policies can change absolute values.
Experiment scope
| Dimension | Values |
|---|---|
| Models | Kimi K2.6, DeepSeek V4 Pro, OpenAI GPT-5.5, MiniMax M3 |
| Topology scales | XS, Small, Medium, Large |
| Fault types | 12 canonical types across link, routing, impairment, system, and ACL categories |
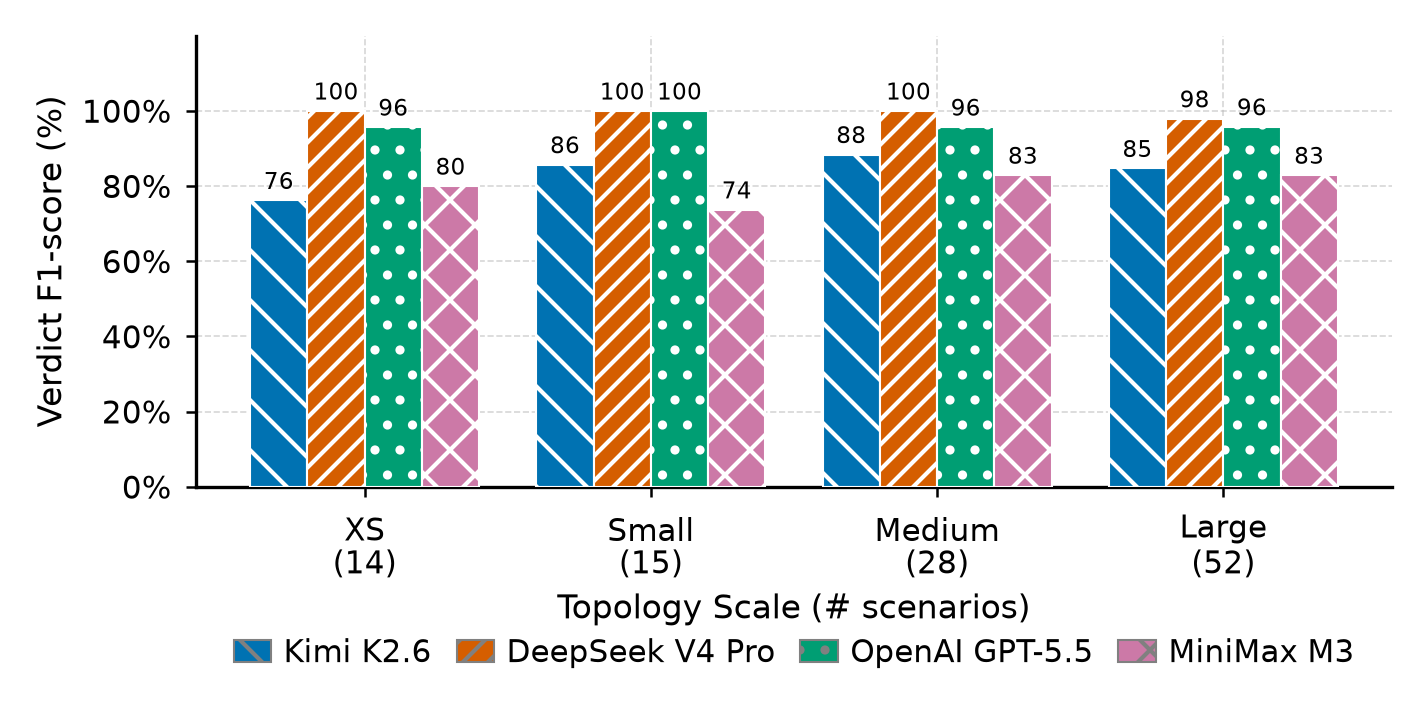
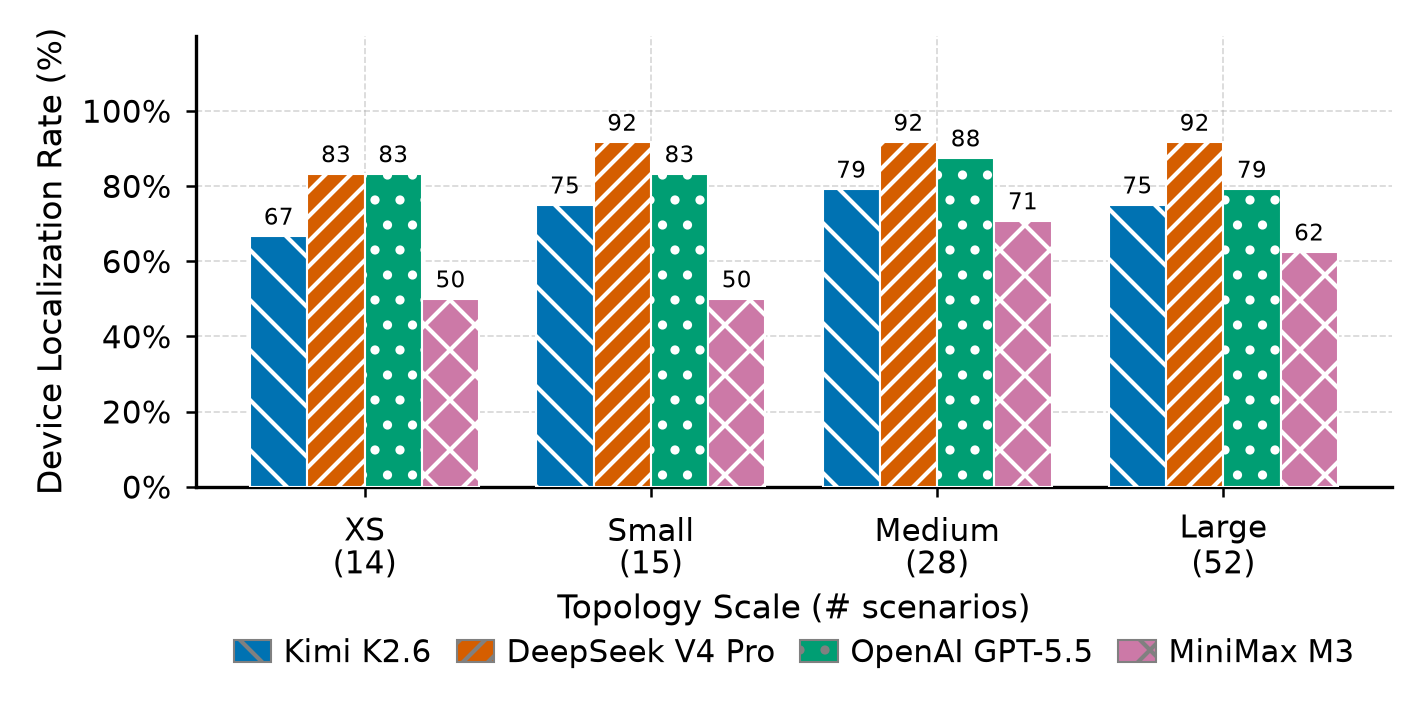
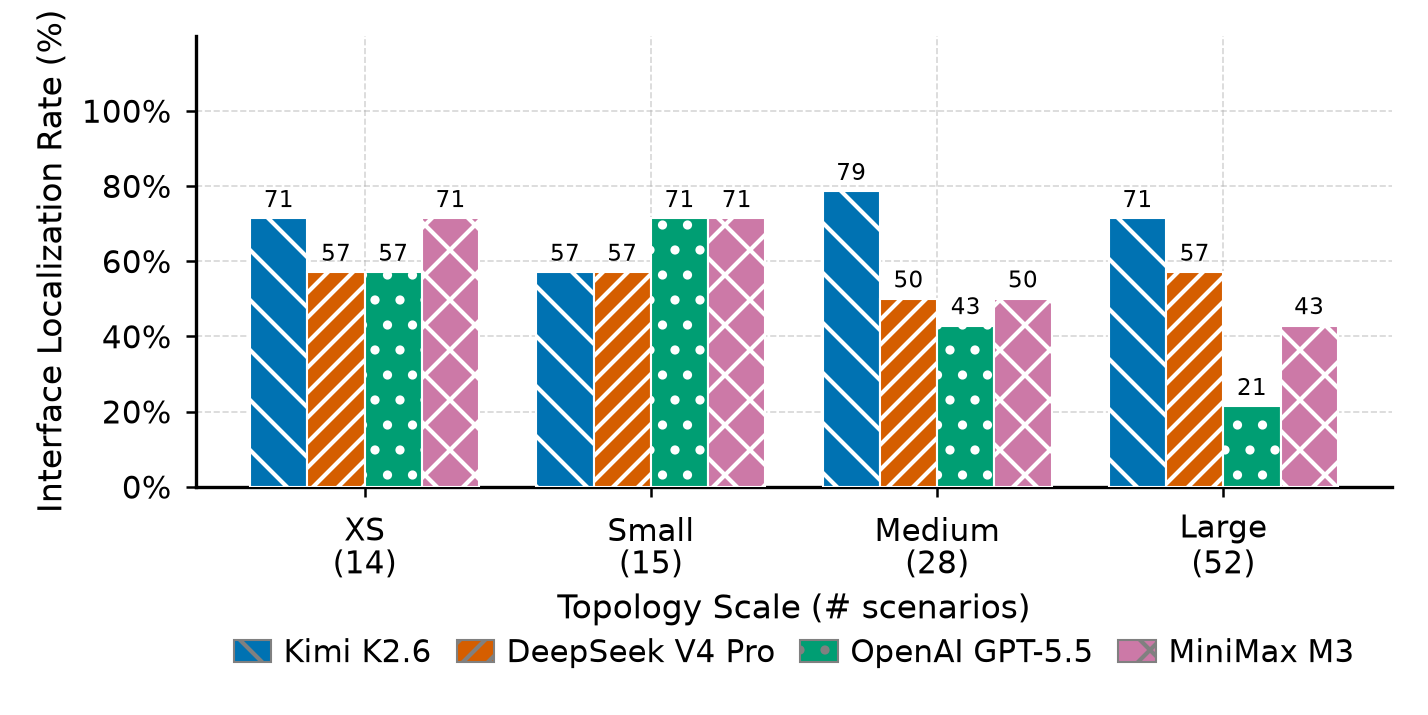
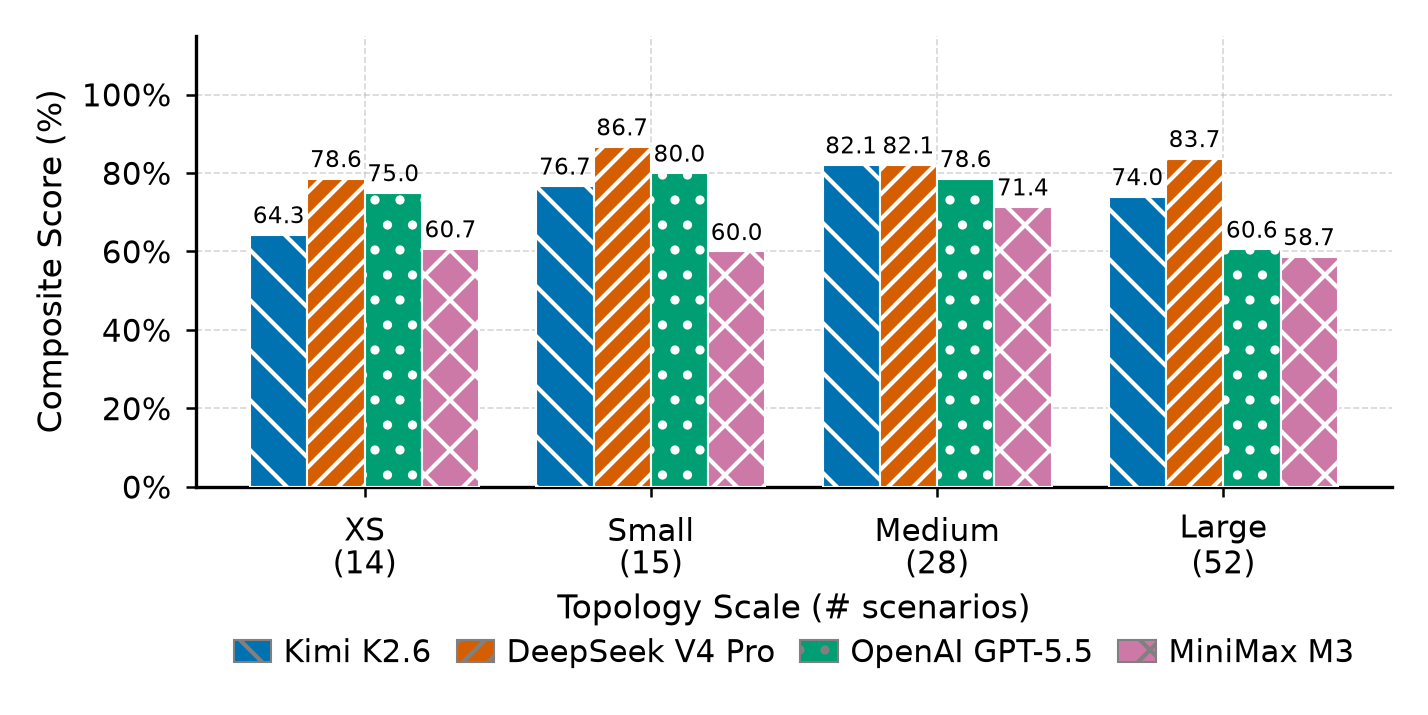
| Quality metrics | Verdict F1-score, device localization, interface localization, composite score |
| Efficiency metrics | Diagnosis time, tool calls, input/output tokens |
Cross-scale snapshot
Each cell is XS -> Large.
| Model | Verdict F1 (%) | Device Loc (%) | Interface Loc (%) | Composite (%) | Avg Time (s) | Avg Tools | Input Tokens (K) |
|---|---|---|---|---|---|---|---|
| Kimi K2.6 | 76.2 -> 84.7 | 66.7 -> 75.0 | 71.4 -> 71.4 | 64.3 -> 74.0 | 272.0 -> 399.5 | 36.5 -> 38.8 | 367.6 -> 741.1 |
| DeepSeek V4 Pro | 100.0 -> 97.9 | 83.3 -> 91.7 | 57.1 -> 57.1 | 78.6 -> 83.7 | 83.1 -> 83.1 | 24.9 -> 20.7 | 247.6 -> 477.3 |
| OpenAI GPT-5.5 | 95.7 -> 95.8 | 83.3 -> 79.2 | 57.1 -> 21.4 | 75.0 -> 60.6 | 71.9 -> 85.0 | 17.9 -> 15.9 | 85.4 -> 153.7 |
| MiniMax M3 | 80.0 -> 82.9 | 50.0 -> 62.5 | 71.4 -> 42.9 | 60.7 -> 58.7 | 214.3 -> 230.3 | 26.4 -> 24.0 | 133.3 -> 316.1 |
The main pattern is that verdict classification remains easier than precise localization. Interface localization is the weakest metric on larger topologies.
Quality metrics
Runtime cost
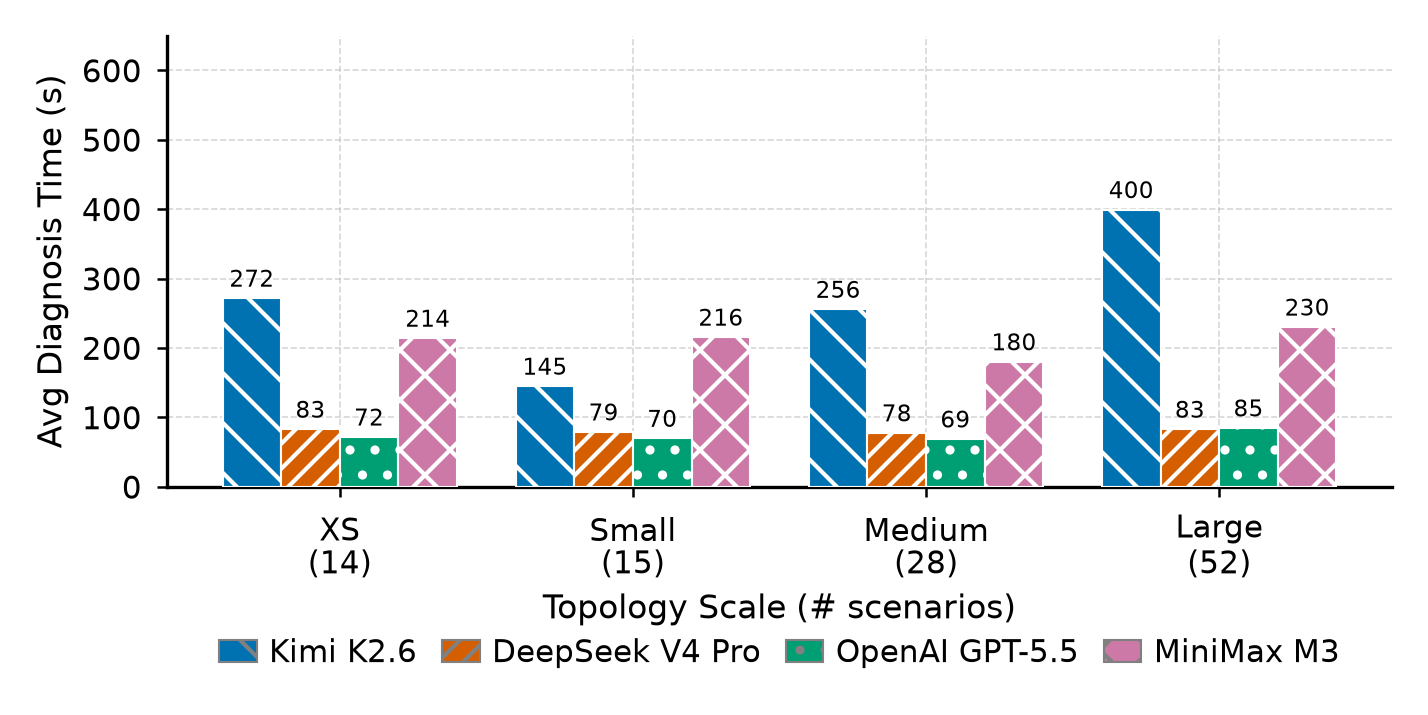
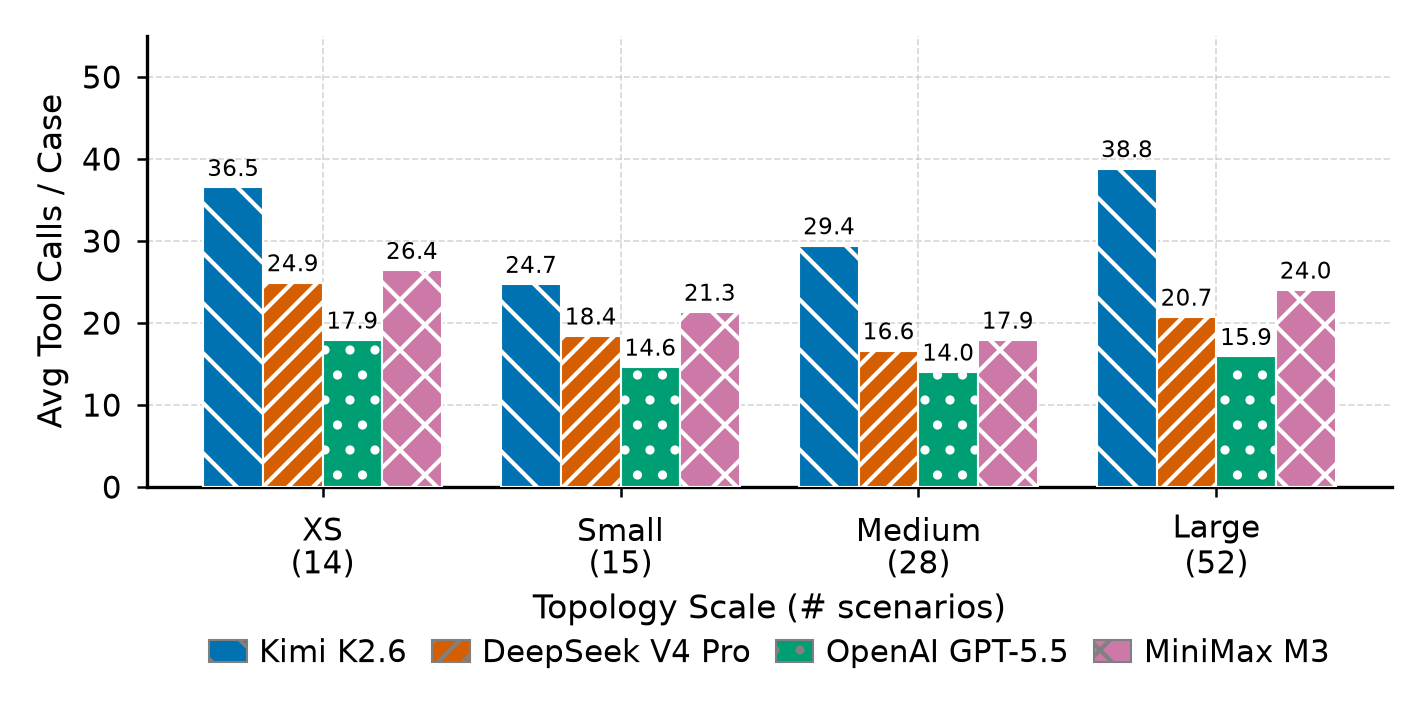
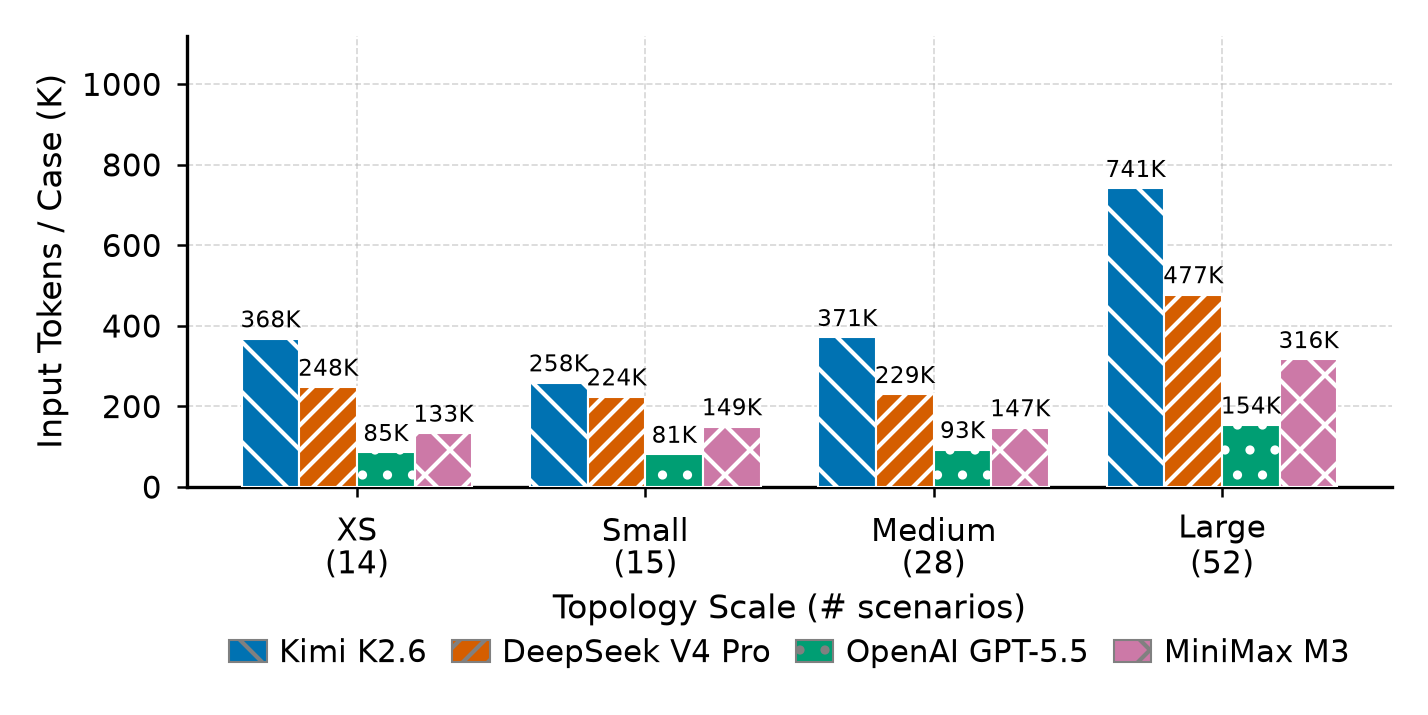
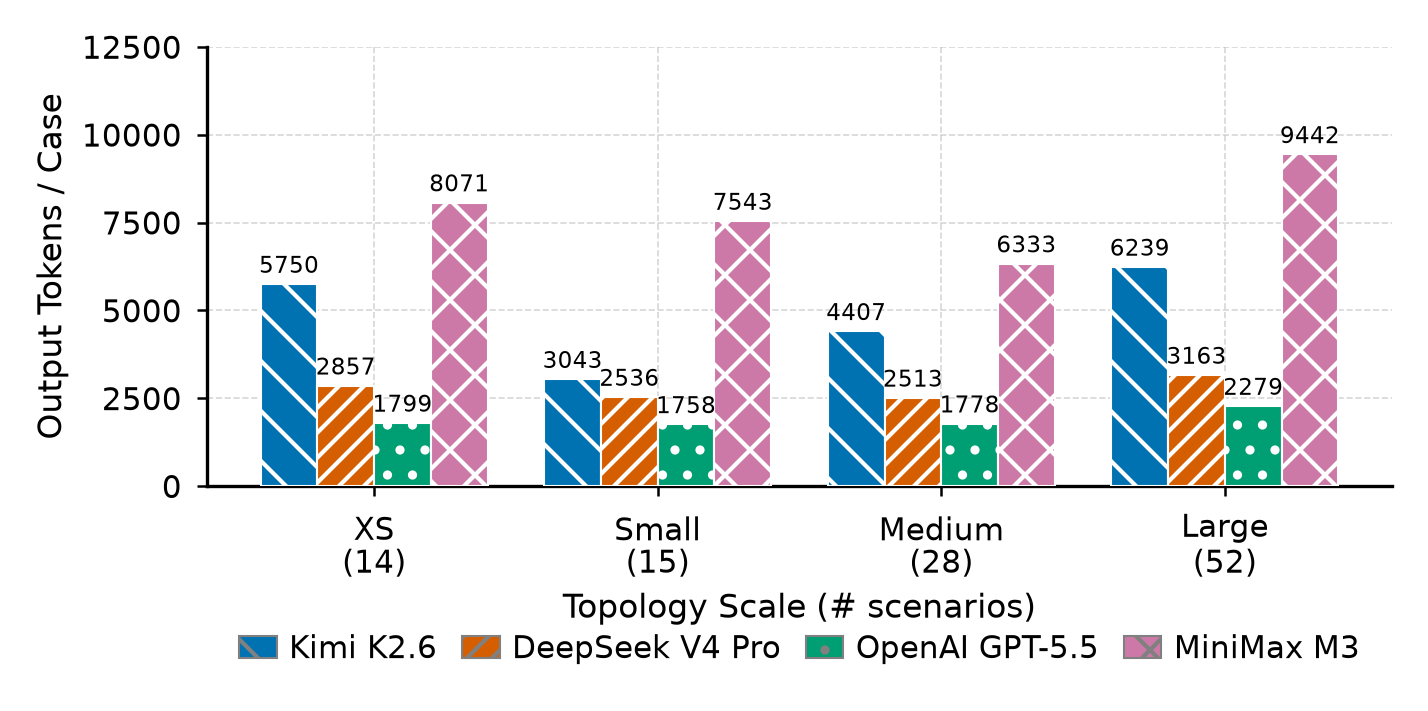
Compare cost metrics with localization quality, not verdict quality alone. Higher tool or token use does not automatically improve device or interface precision.