Operations
Inspect observability, preserve runtimes, reproduce the stack, and clean up labs.
Most benchmark runs use automatic runtime lifecycle management. Use this page only when a run needs inspection, a runtime should remain alive, or low-level observability must be reproduced by hand.
Grafana and worker buckets
NetOpsBench starts InfluxDB, Telegraf, Grafana, and Pingmesh during benchmark runs.
URL:      http://localhost:3000
Username: admin
Password: admin
Grafana and InfluxDB bind to loopback so the development credentials are not
exposed on shared hosts. For remote access, use an SSH tunnel such as
ssh -L 3000:127.0.0.1:3000 <host>. If a local proxy intercepts the request,
set NO_PROXY=localhost,127.0.0.1.
Grafana dashboards use a Bucket drop-down. Benchmark data lives in worker buckets, not in the default housekeeping bucket.
| Run mode | Bucket pattern |
|---|---|
| One scenario | network_data_xs_w01 |
| XS suite with 3 workers | network_data_xs_w01 through network_data_xs_w03 |
| Scale benchmark | network_data_{scale}_w01 through the configured worker count |
| Manual runtime | Worker bucket printed by the runtime script |
Useful dashboards:
| Dashboard | Use |
|---|---|
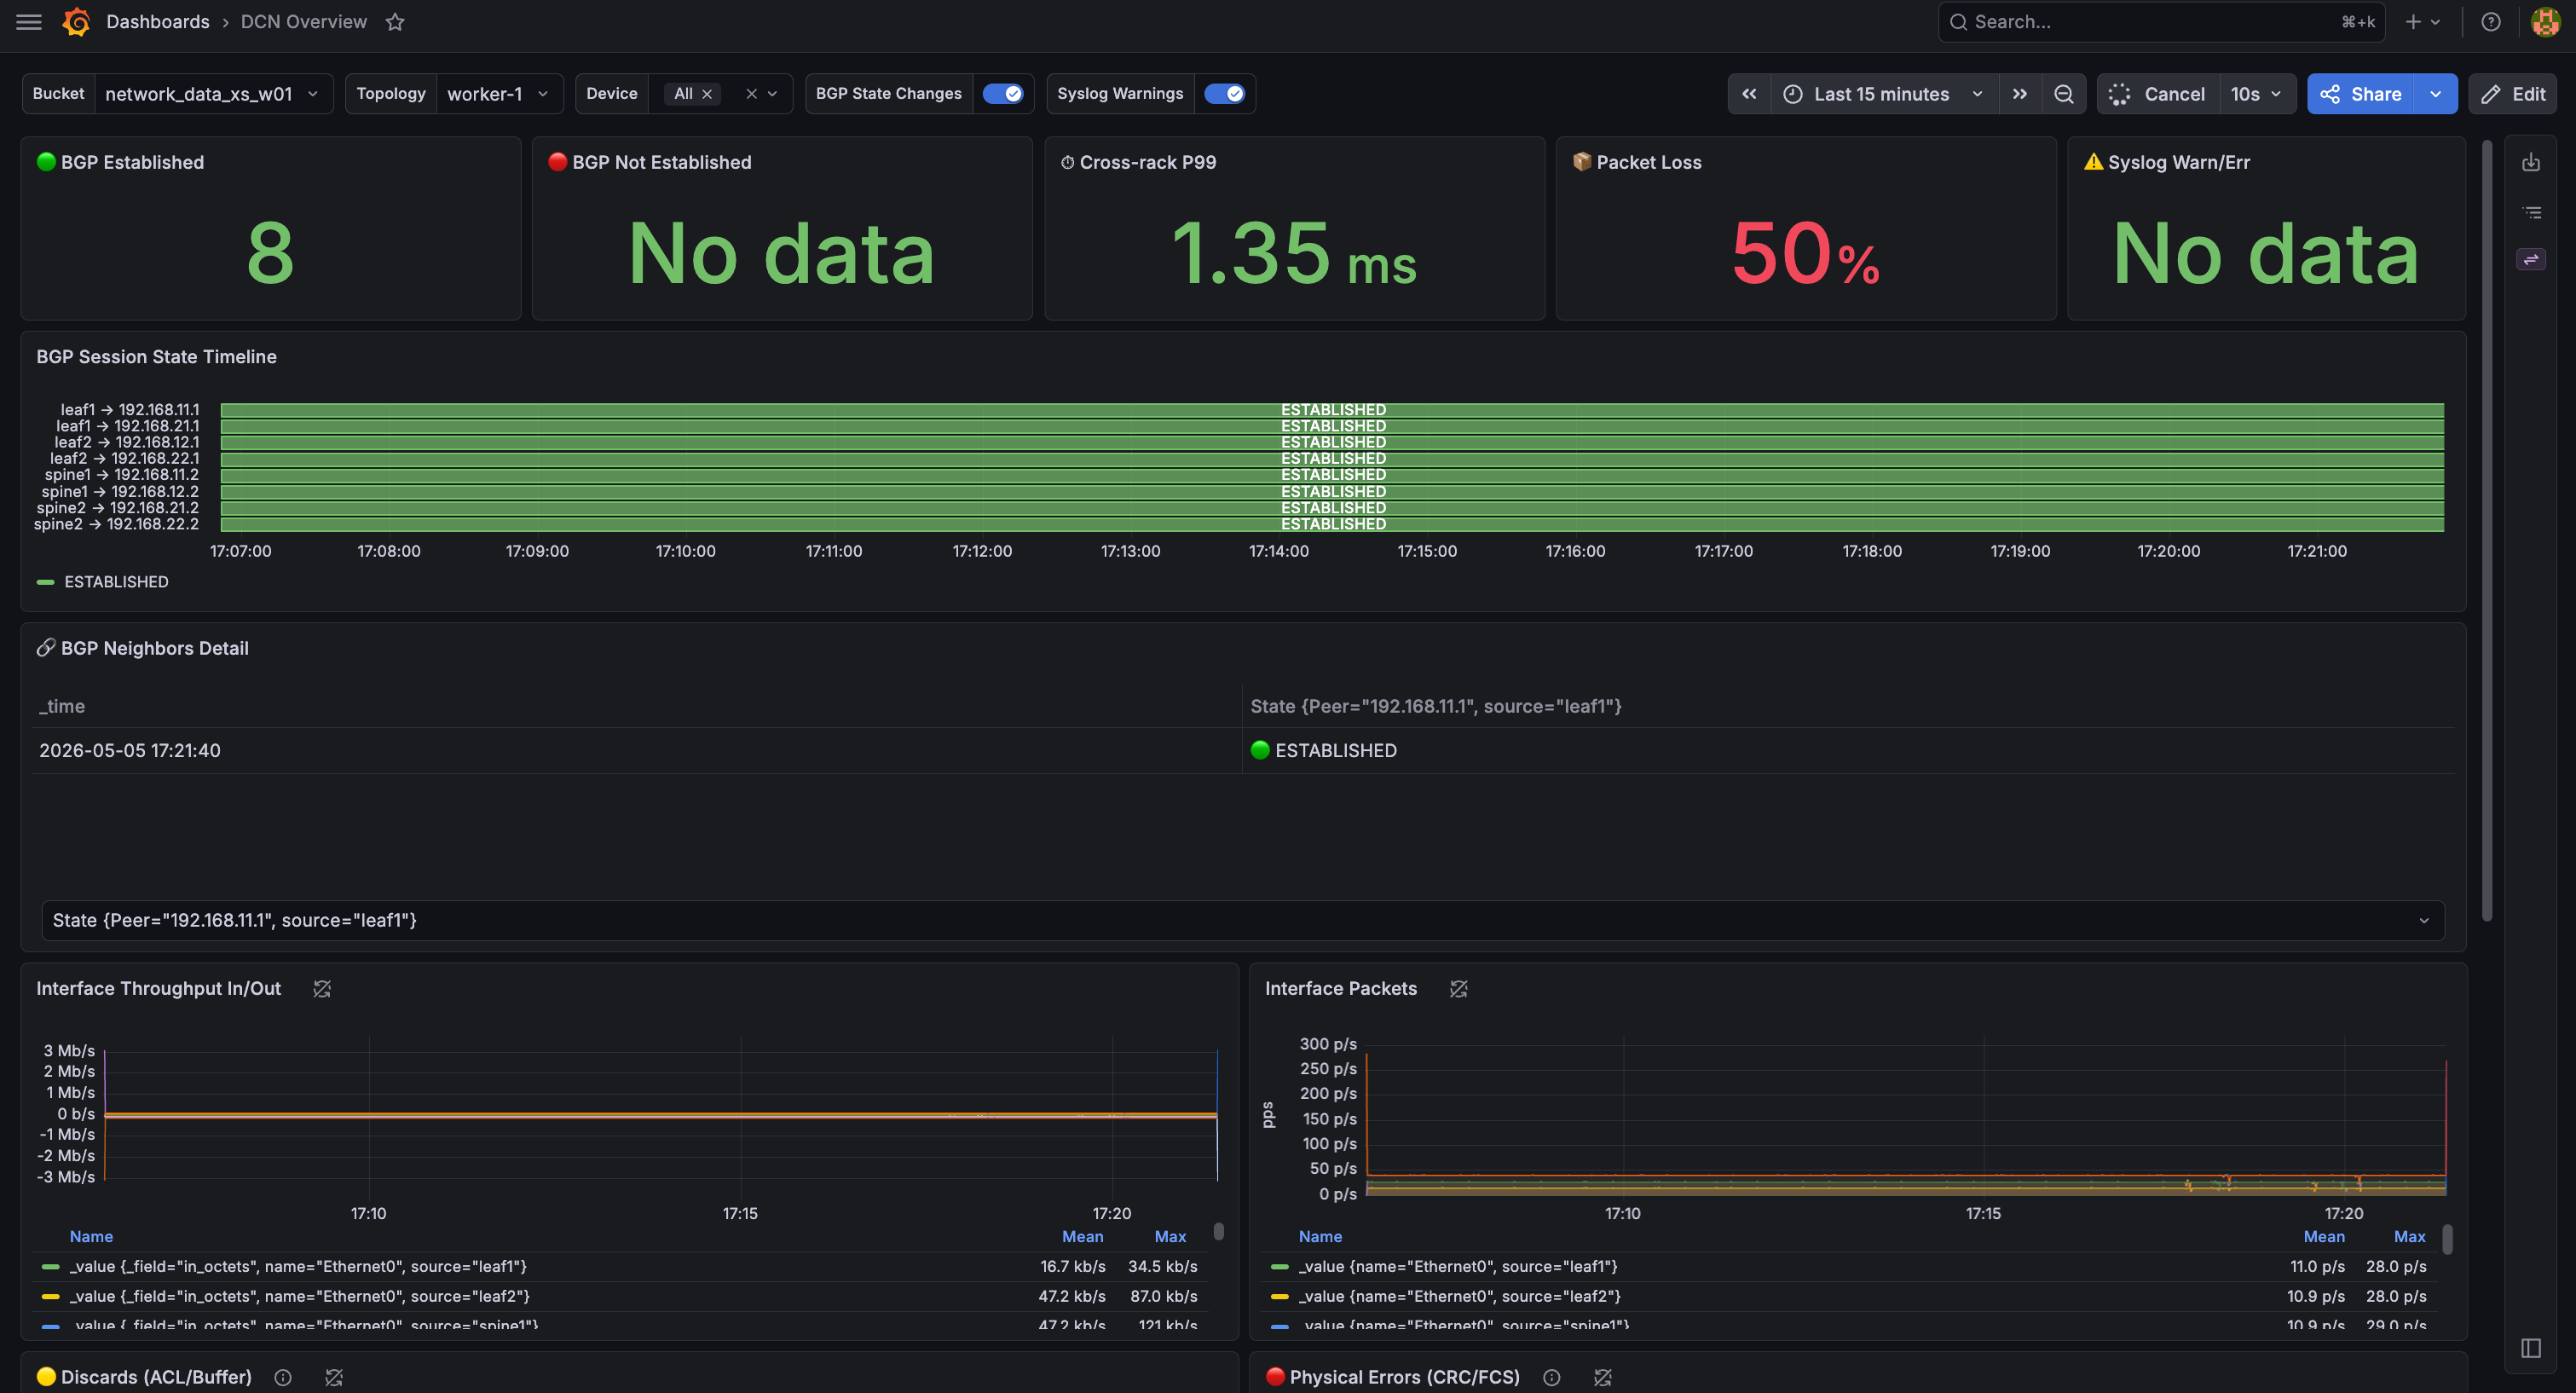
| DCN Overview | BGP state, interface traffic, packet loss, syslog, and fabric health. |
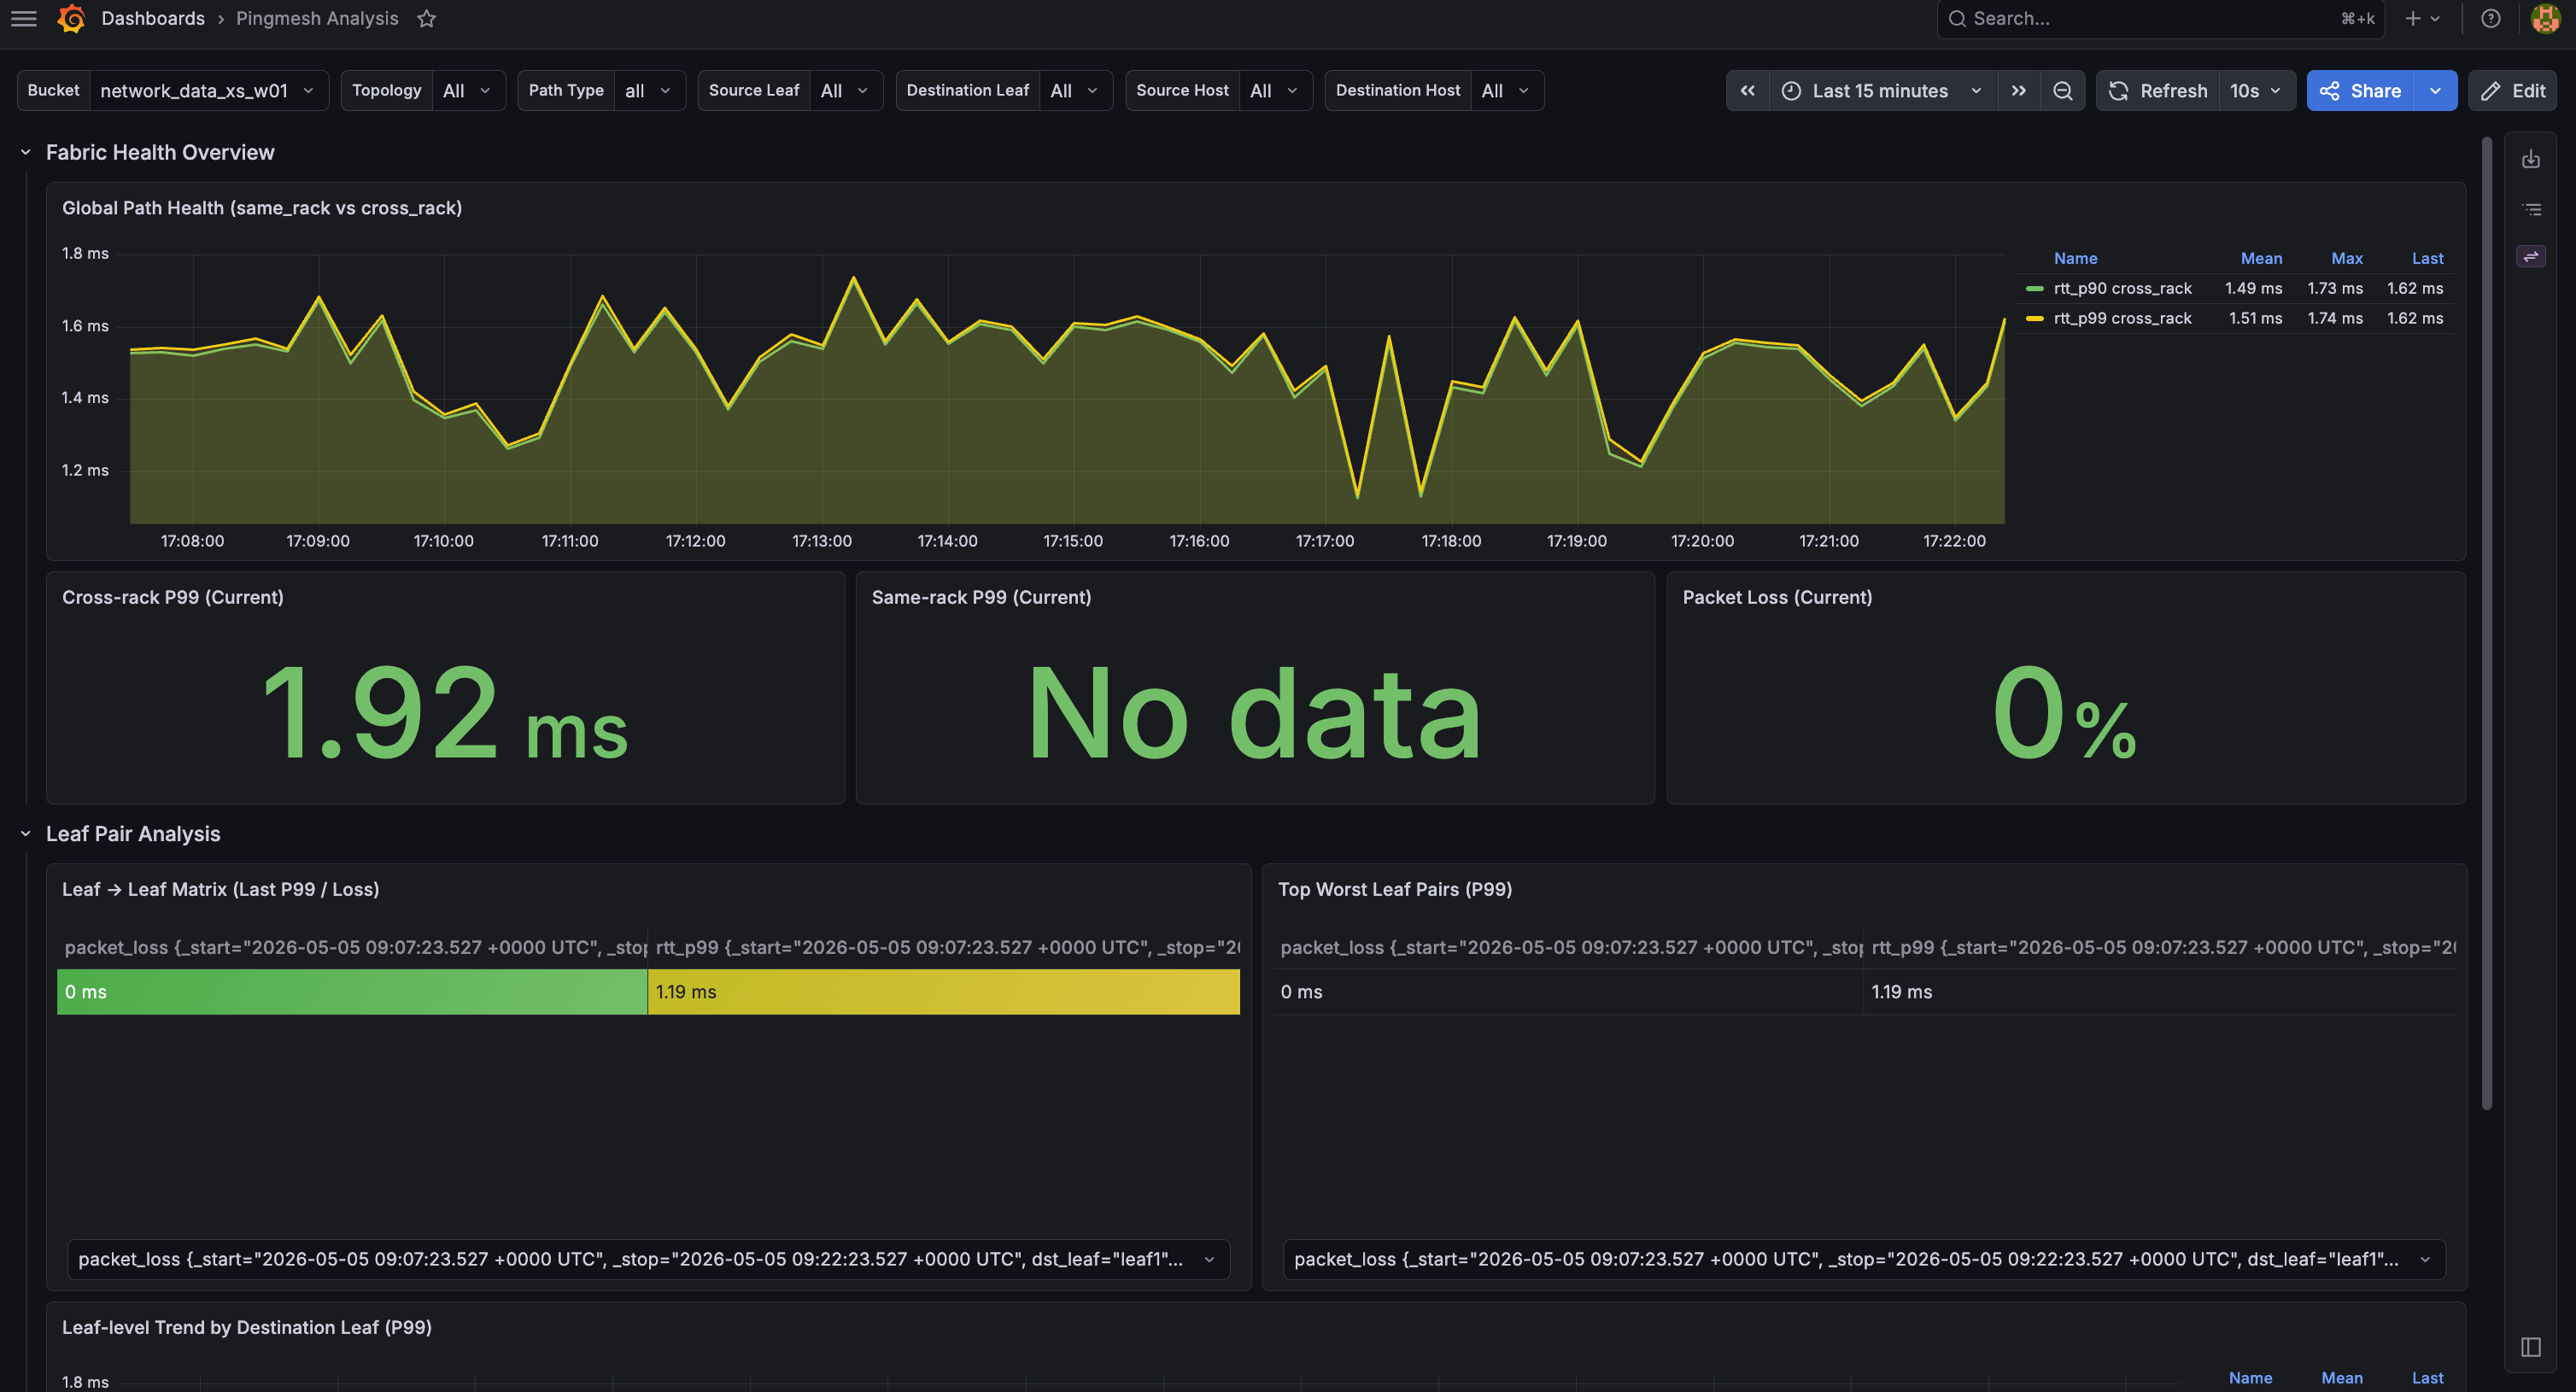
| Pingmesh Analysis | Path latency, path loss, worst leaf pairs, and source/destination narrowing. |
Common states
| Symptom | Likely cause | Action |
|---|---|---|
| No data in every panel | Wrong bucket or no active runtime | Select network_data_{scale}_w{n} or start a runtime. |
| No same-rack P99 on XS | XS has two racks with one client per rack | Use cross-rack panels on XS. |
| Packet loss spikes during a scenario | Fault episode is active | Expected during the observation window. |
| Packet loss remains after recovery | Cleanup or recovery may not have completed | Inspect scenario logs and preserved runtime state. |
| BGP panels show non-established peers | Startup convergence or control-plane disruption | Check the scenario window and device logs. |
| Telegraf data appears late | Scrape interval and startup lag | Wait about 30 seconds, then inspect Telegraf logs. |
Preserve a runtime
Automatic examples tear down the runtime after the report is collected. examples/05_manual_runtime.py keeps a runtime alive:
PYTHONPATH=. python examples/05_manual_runtime.py --repo-root .The script provisions a runtime and runs a scenario through the existing-runtime API:
runtime = bench.runtimes.provision(scale="xs", workers=1, name=runtime_name)
run = bench.sessions.run_on_runtime_scenario(
    scenario=scenario,
    runtime=runtime,
    agent=agent,
    artifacts_dir=artifacts_dir,
)
Because the runtime is caller-owned, it remains active until explicit teardown.
Useful checks:
sudo containerlab inspect -t lab-topology/generated_topology_xs/dcn.clab.yaml
docker ps | grep clab-dcn
docker ps | grep -E "influxdb|telegraf|grafana"
docker logs telegraf | tail -20
Reproduce observability manually
Manual deployment is for debugging the observability stack outside an SDK-managed run.
# 1. Generate and deploy an XS topology
bash scripts/runtime/deploy.sh xs lab-topology

# 2. Point tooling at the active topology
export NETOPSBENCH_TOPOLOGY_DIR="$PWD/lab-topology/generated_topology_xs"
deploy.sh generates topology metadata, renders Telegraf config, starts InfluxDB / Telegraf / Grafana, and starts the native Pingmesh and background-traffic processes in each client.
The default client image is pinned by digest. A custom client image must provide
/usr/local/bin/netopsbench-client-agent; runtime preparation fails explicitly
when the binary is absent.
Common overrides:
export NETOPSBENCH_MGMT_SUBNET=172.31.250.0/24The default SONiC image and the observability containers are pinned by digest.
The generated gNMI contract uses 50051, admin, json_ietf,
COUNTERS_DB, and a 10-second sampled subscription. Runtime-owned InfluxDB
buckets retain raw telemetry for seven days; attaching an existing
user-managed bucket never changes that bucket's retention policy. The default
standalone netopsbench bucket is also initialized with seven-day retention.
Successful runtime teardown deletes only the exact bucket recorded as created for that runtime by the current workspace. This prevents a same-name runtime from reading stale telemetry. Existing user-managed buckets are never adopted or deleted.
Cleanup
SDK-visible runtimes:
netopsbench runtime list
netopsbench runtime show <runtime-name>
netopsbench runtime teardown <runtime-name>
netopsbench runtime teardown --all
Manual deployment teardown:
bash scripts/runtime/teardown.sh lab-topology/generated_topology_xsInfluxDB buckets can be inspected directly when debugging retained evidence:
sudo docker exec influxdb influx bucket list \
  --host http://localhost:8086 \
  --token "$NETOPSBENCH_INFLUXDB_TOKEN"